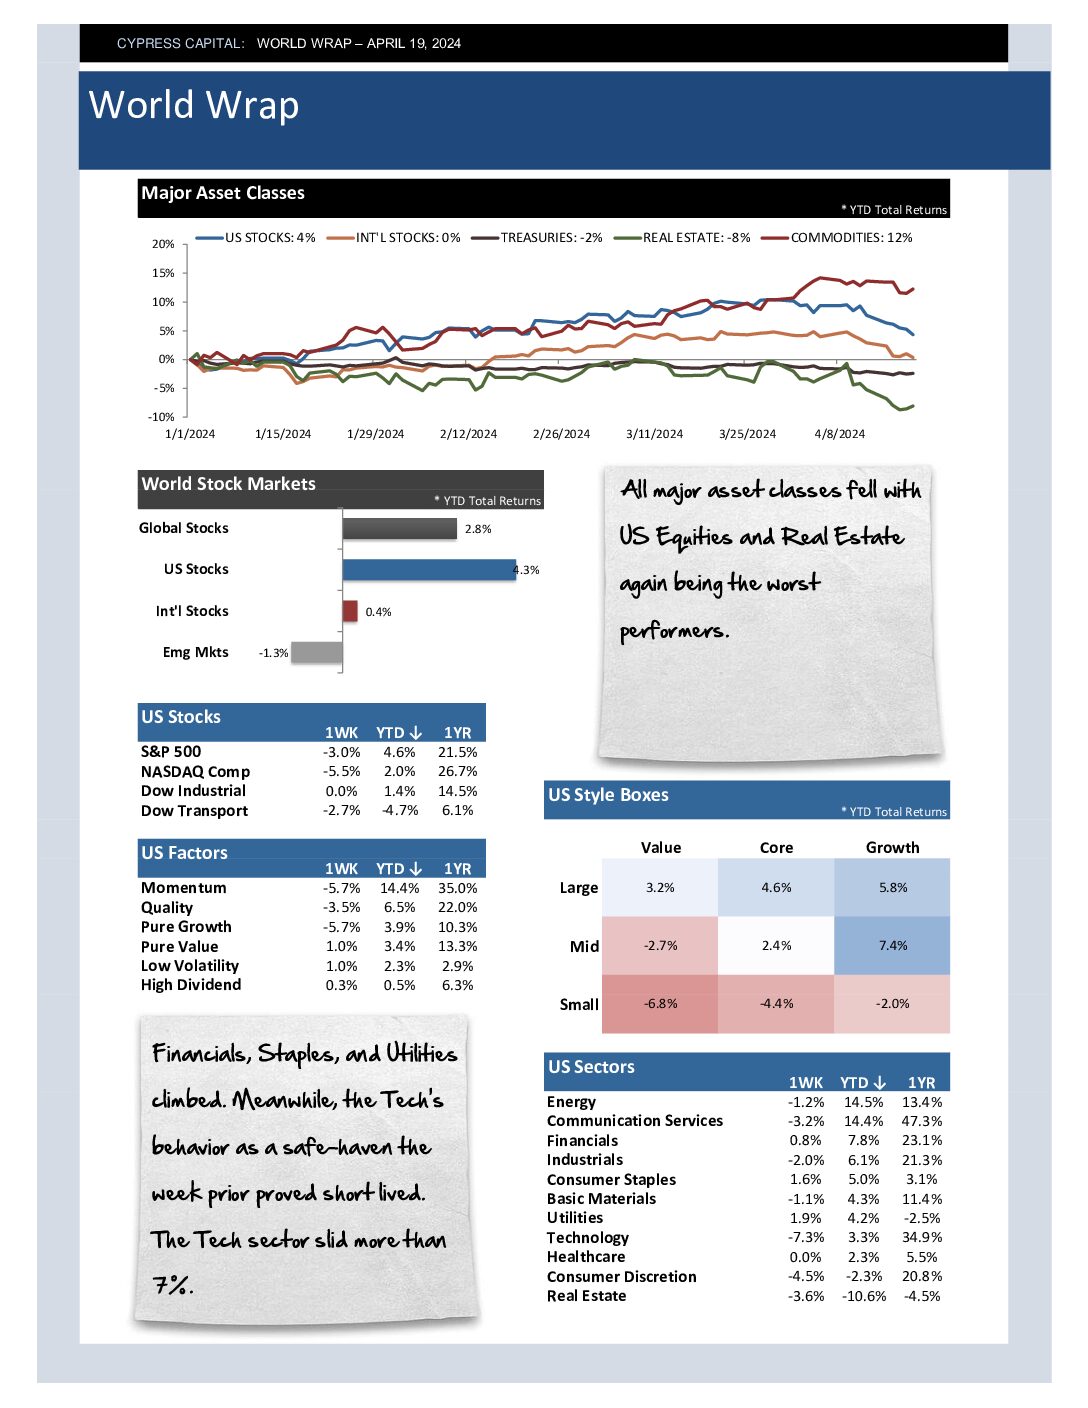
Archive

World Wrap

World Wrap

– Global equities posted strong gains for the week, led by U.S. stocks. U.S. Treasury prices fell, with yields climbing.
– A broad-based rally took hold across styles, sectors, and factors, echoing a familiar pattern—large caps and Tech out front.
– Emerging markets outperformed internationally, boosted by strong results from India and Taiwan.
– U.S. Treasuries showed signs of strain amid concerns over a deficit-expanding budget, with the 30-year yield nearing 5%.

World Wrap

World Wrap

– Prices on U.S. equities and Treasuries declined modestly, while commodity prices rebounded.
– Style performance was mixed, with large caps falling and all small- and mid-cap styles advancing. Healthcare stocks fell more than 4%.
– Emerging markets outperformed, driven by rallies in China, Taiwan, Brazil, and Mexico.
– Crude oil rebounded over 4% to above $60. Gold rose too, but it’s on its longest streak without a new high this year.

World Wrap

World Wrap

– Global equities rallied, led by international stocks. Commodity prices declined as crude oil fell to four-year lows.
– There was a broad rally, with growth and momentum stocks outperforming. Energy was the only sector to decline last week.
– International stocks outperformed, and all major global regions are ahead of U.S. stocks year-to-date.
– Weak economic growth and inflation headlines pushed Treasury yields modestly higher. Crude oil prices fell below $60 per barrel for the first time since 2021.

World Wrap

World Wrap

– Global risk assets advanced, with the exception of commodities, which were pulled lower by falling crude oil prices.
– The worst-performing year-to-date sectors rebounded the most last week. Consumer Staples, 2025’s best performer, was the only declining sector.
– There was a broad rally internationally, with 41 of 45 countries advancing. European stocks continue to outperform.
– Treasury yields fell modestly, and the dollar stabilized as the Trump administration softened its tone on tariffs.

%

Market Risk Index

Market Risk Index scales from 0 to 100%. Higher readings correspond with higher risk markets. Scores below 25% are bullish. Scores between 25-75% are neutral, and scores above 75% are markets vulnerable to major drawdowns.

Model Category Readings (Percentiles)

  • Psychology 99.7% 99.7%
  • Monetary 87.2% 87.2%
  • Valuation 99.3% 99.3%
  • Market Trend 9.8% 9.8%