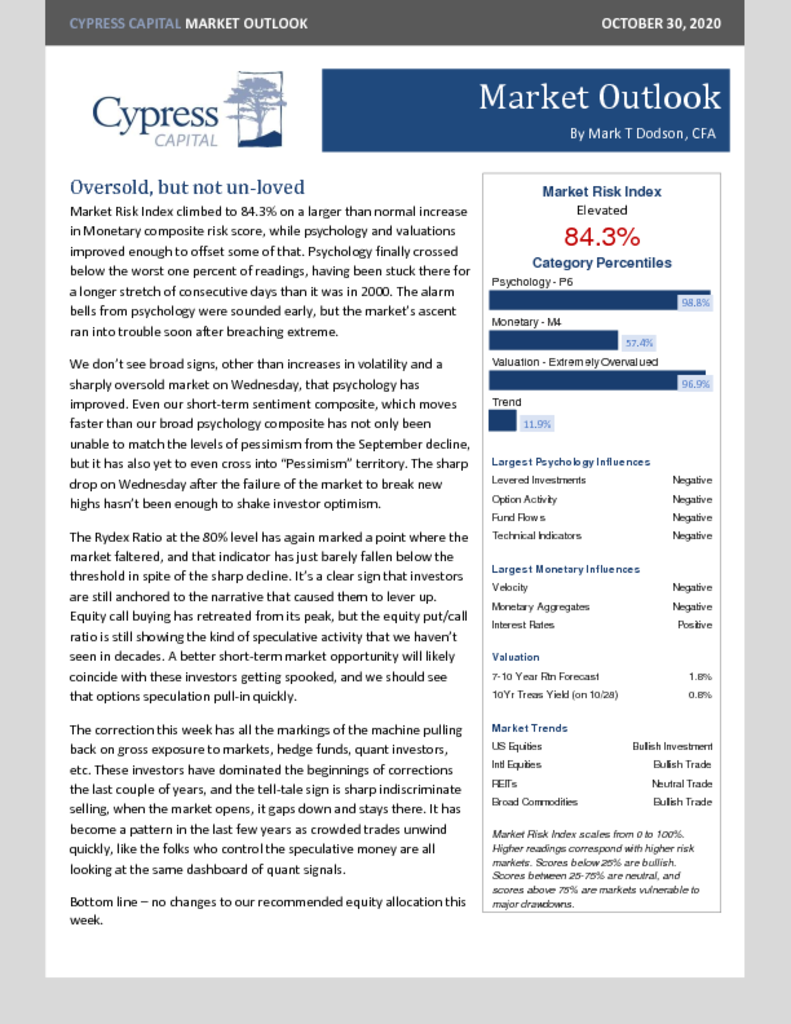
– Market Risk Index increases alongside our Monetary composite risk score.
– The market has grown oversold, but few signs that is translating into a substantial change in investor sentiment.
– …and the best charts this week had to offer.

– Market Risk Index increases alongside our Monetary composite risk score.
– The market has grown oversold, but few signs that is translating into a substantial change in investor sentiment.
– …and the best charts this week had to offer.
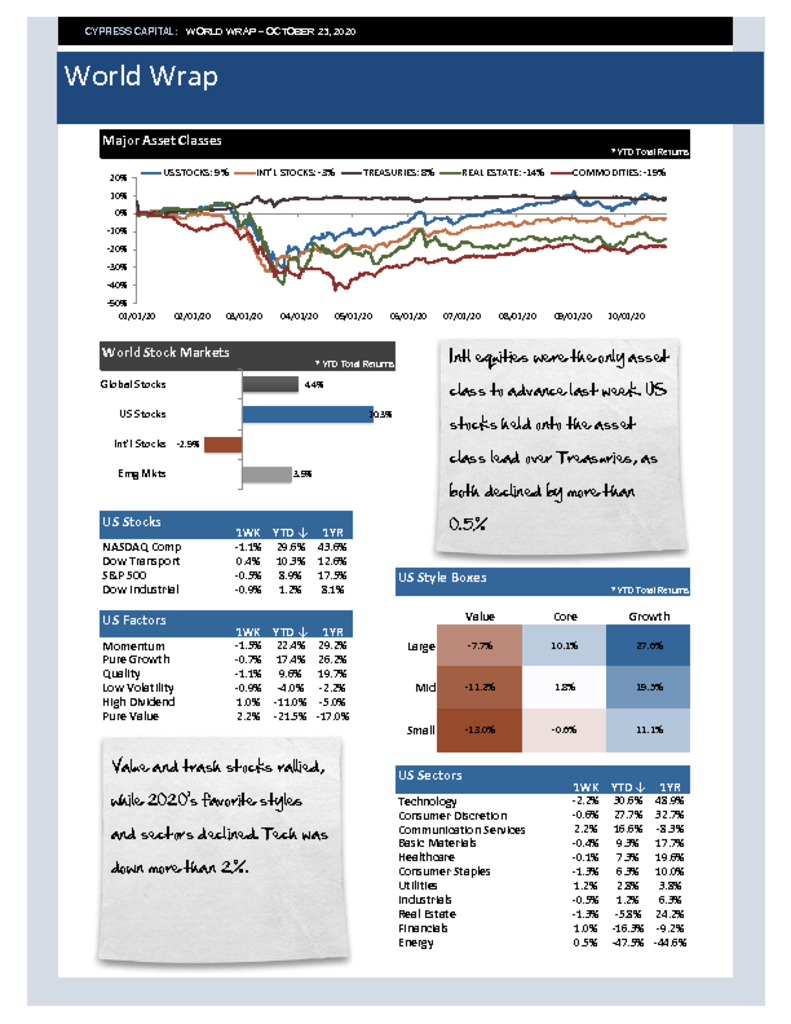
– Intl equities were the only asset class to advance last week. US stocks held onto the asset class lead over Treasuries, as both declined by more than 0.5%
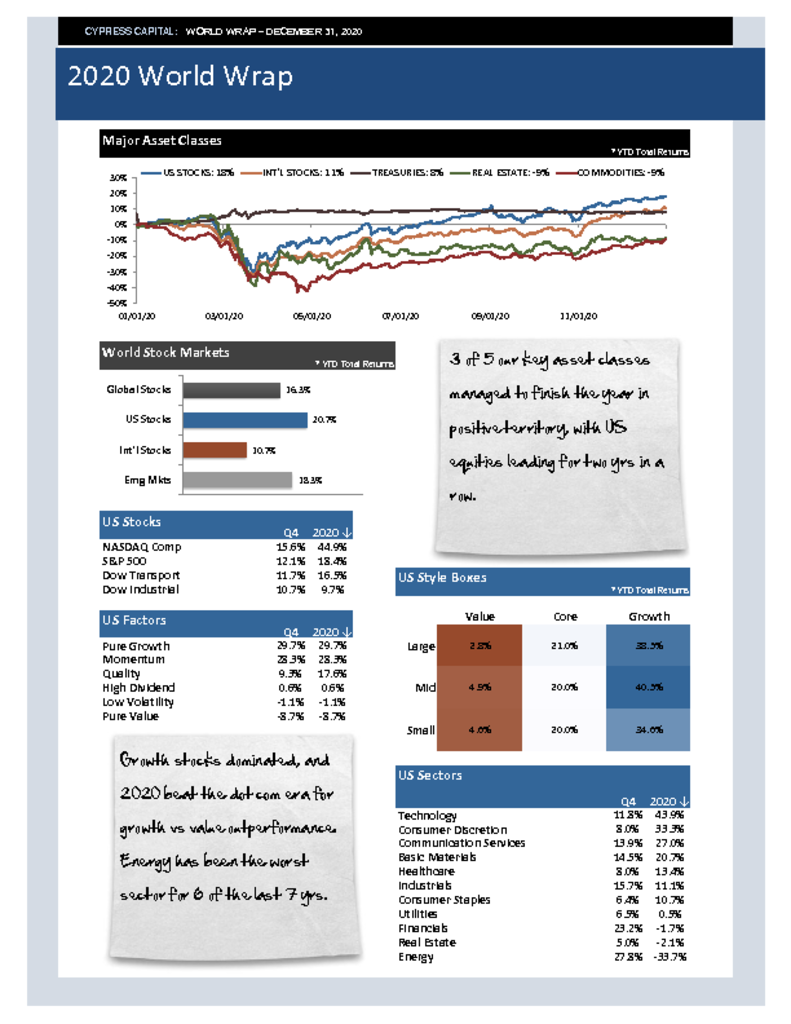
– Value and trash stocks rallied, while 2020’s favorite styles and sectors declined. Tech was down more than 2%.
– Foreign stocks bucked the trend and advanced but have more ground to cover – the median country is still down 7.1% ytd.
– Treasury yields continued to advance and are now challenging the June 5th peak in yields. Bitcoin broke to new highs on news of adoption by Paypal.
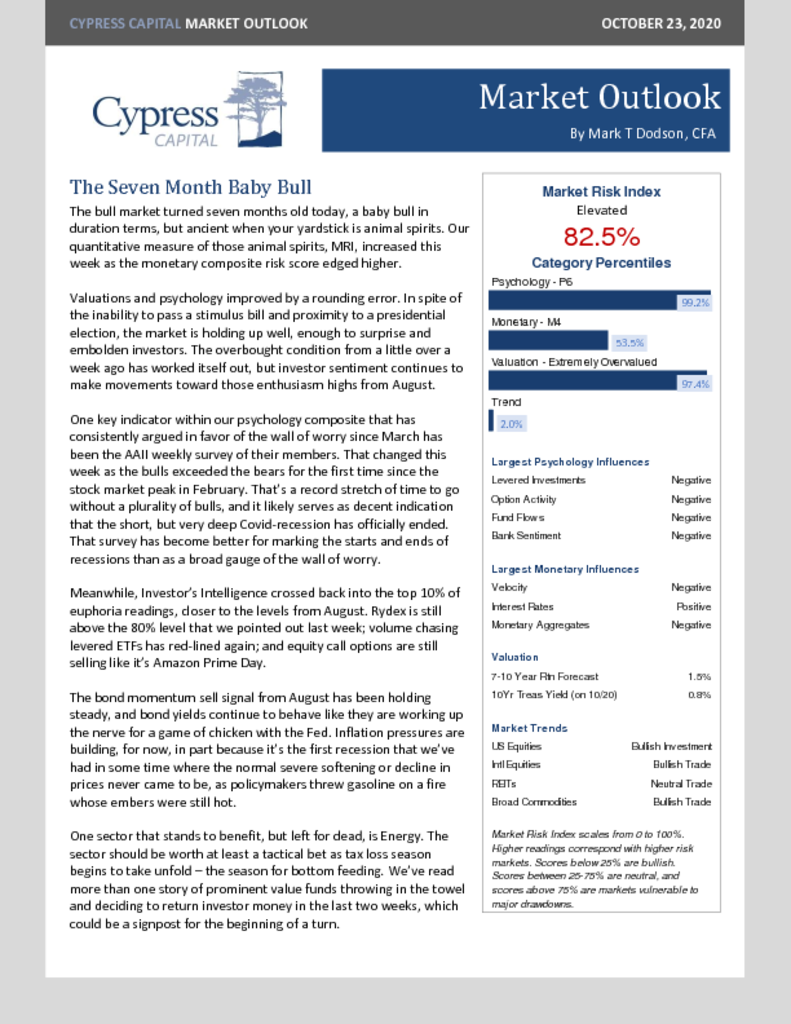
– A baby bull in duration but ancient in animal spirits terms.
– Investor psychology pushing back toward August highs.
– AAII ends a record stretch of bearish sentiment.
– Bottom feeding the Energy sector
– US stocks up modestly, while international stocks declined. US REITs were the worst performing asset class.
– A choppy week – US stocks moved higher but more sectors declined than advanced.
– Chinese stocks climbed 2.6% last week- China’s equity markets are up more than 20% year to date. It’s market cap has surpassed its 2015 high.
– Both the dollar and US Treasuries rallied modestly. Commodities were mixed.
%
Market Risk Index scales from 0 to 100%. Higher readings correspond with higher risk markets. Scores below 25% are bullish. Scores between 25-75% are neutral, and scores above 75% are markets vulnerable to major drawdowns.
Model Category Readings (Percentiles)