Archive

World Wrap

World Wrap

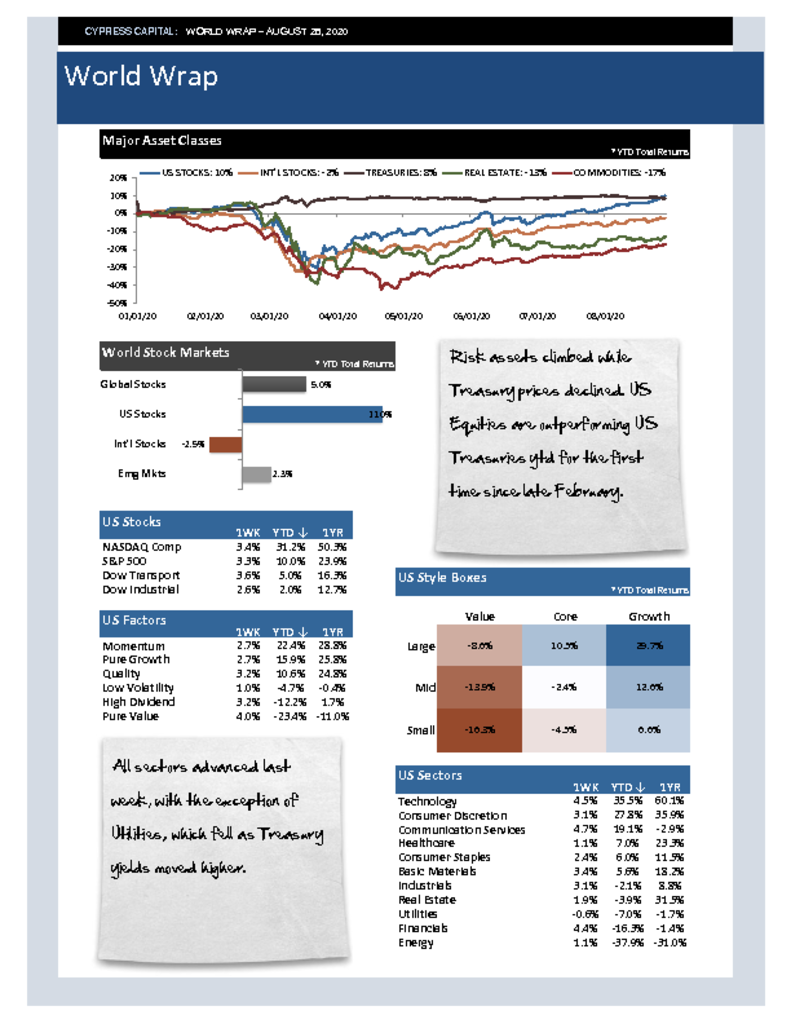
– Risk assets climbed while Treasury prices declined. US Equities are outperforming US Treasuries ytd for the first time since late February.
– All sectors advanced last week, with the exception of Utilities, which fell as Treasury yields moved higher.
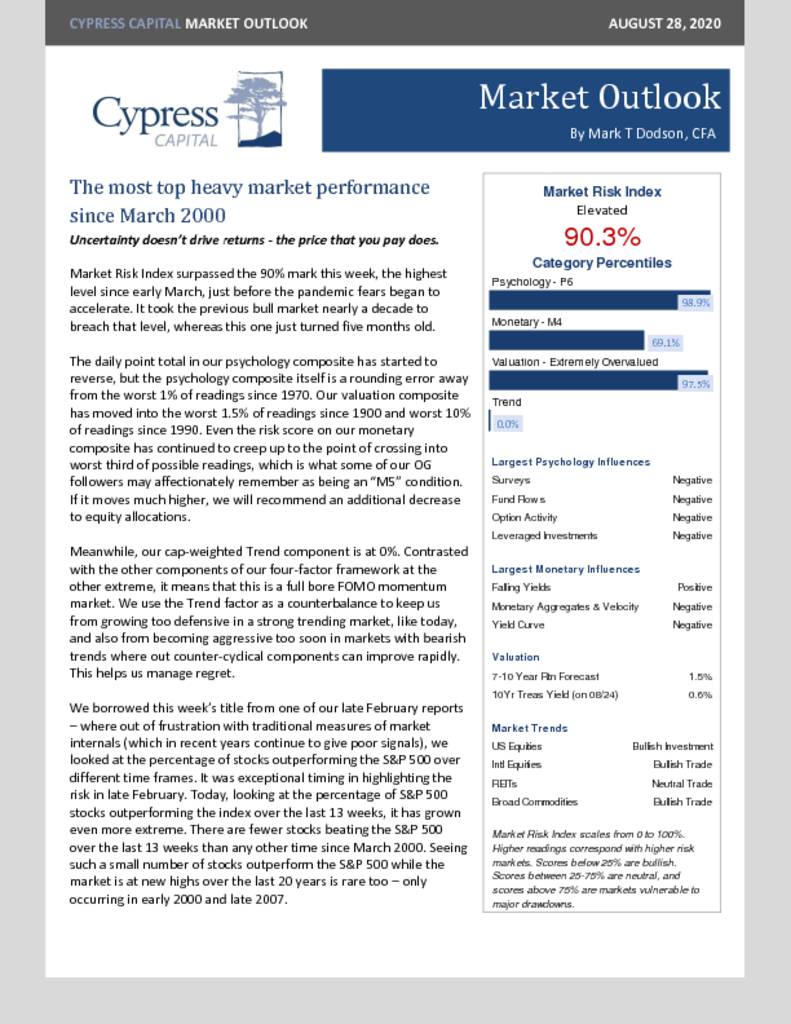
– Prices for long duration Treasuries fell nearly 3% last week, and our bond momentum gauge is likely to close out the month with an official sell signal.
– Lumber prices continued their streak, advancing another 10% and have climbed over 125% year to date as a result of Covid related supply disruptions.

Market Outlook – The most top heavy market performance since March 2000

Market Outlook – The most top heavy market performance since March 2000

– Market Risk climbs above 90%. Psychology, Monetary and Valuation all deteriorate.
– The most narrow market performance since March 2000, and probably the nuttiest market environment that we’ve ever seen.
– Signs of excessive speculation abound, when they normally wouldnt.
– And, the best in charts this week…our favorite…the idea that our tax code has bene subsidizing automation over people.

World Wrap

World Wrap

– It was another mixed week. US equities, Treasuries, and commodities moved higher, while Real Estate and International Equities declined.
– In another reversal, Tech & Momentum rally, while Energy, Financials & Value drop. For several wks, mkt action has been a widening or narrowing of this gap.-
– US Treasury prices bounced back last week after spooking investors the week prior. Yields made a lower high relative to a similar spike in early June.
– Lumber shortages continue to put upward pressure on prices. Lumber prices were up another 14% last week and have doubled in 2020.

Market Outlook – A Frothy Market

Market Outlook – A Frothy Market

– Market Risk Index climbs to 89.3%.
– Psychology daily point total now has only two other precedents – February 2020 and Jan-March 2000.
– Monetary conditions deteriorate some as a result of the falling dollar, and the Fed has stopped printing.
– Long Bond Momentum indicator is attempting a sell signal for bonds – the second attempt since June.
– And, this week’s best charts…

%

Market Risk Index

Market Risk Index scales from 0 to 100%. Higher readings correspond with higher risk markets. Scores below 25% are bullish. Scores between 25-75% are neutral, and scores above 75% are markets vulnerable to major drawdowns.

Model Category Readings (Percentiles)

  • Psychology 99.7% 99.7%
  • Monetary 87.2% 87.2%
  • Valuation 99.3% 99.3%
  • Market Trend 9.8% 9.8%