Archive

Market Outlook – A technical driven sell-off more than a sentiment driven one

Market Outlook – A technical driven sell-off more than a sentiment driven one

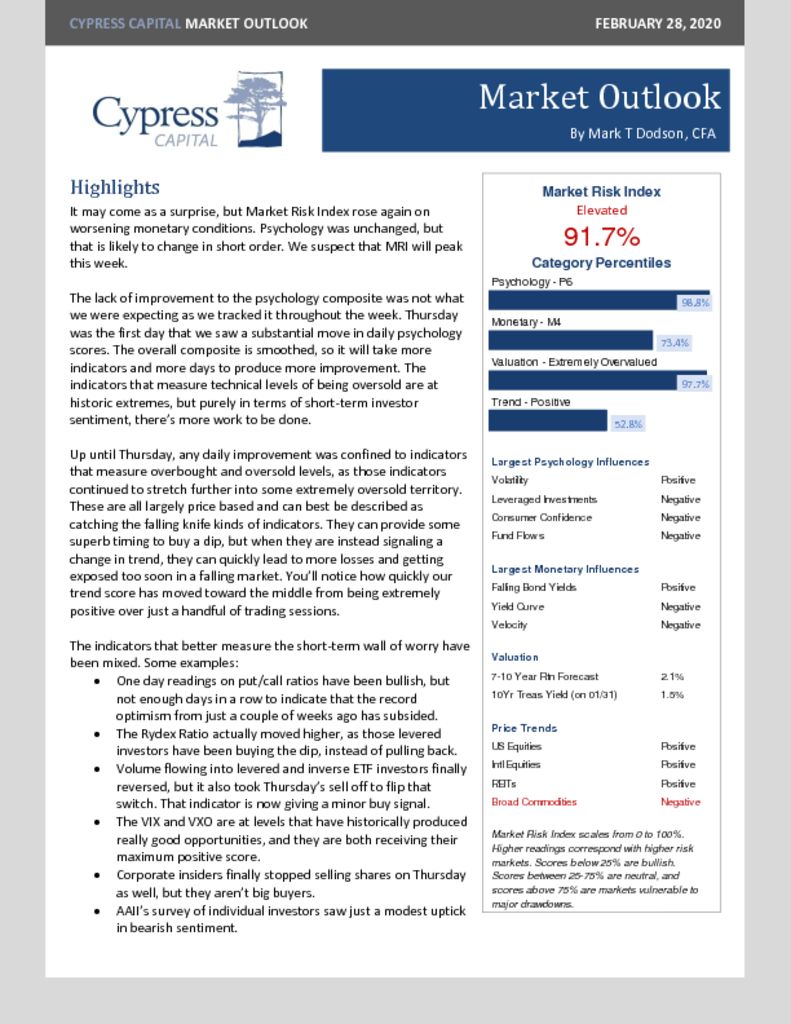
– Market Risk Index increases slightly. Investor psychology was flat, and monetary conditions worsened, but MRI has likely peaked this week.
– The daily point totals of our psychology composite point to a quant-driven sell off more than one driven by investor fear.
– Most extreme readings in McClellan Oscillator and VIX since 2011.
– This week’s price move has been technically historic, but it hasn’t produced much investor anxiety. The desire to make a great call and buy the dip is still there.
World Wrap

World Wrap

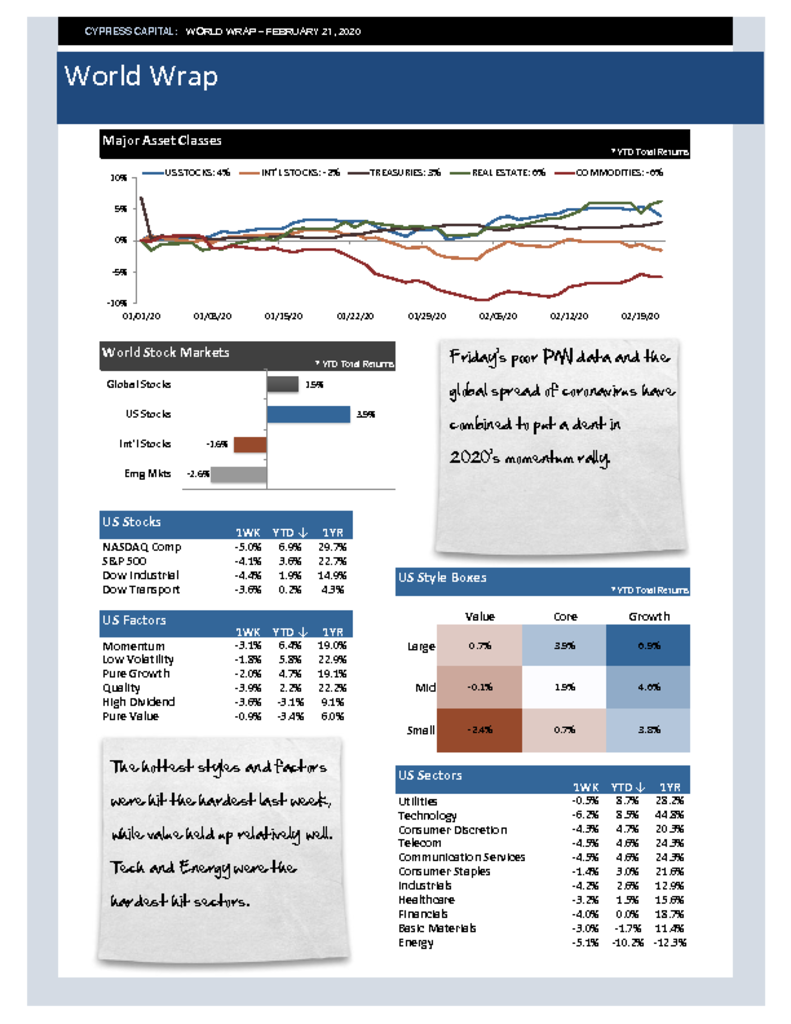
– Friday’s poor PMI data and the global spread of coronavirus have combined to put a dent in 2020’s momentum rally.
– The hottest styles and factors were hit the hardest last week, while value held up relatively well. Tech and Energy were the hardest hit sectors.
– News of spreading coronavirus infection to South Korea, Italy and Iran has investors concerned about global supply chains and global manufacturers.
– Gold climbed 6% last week. Odds of a Fed rate cut in March are growing.

Market Outlook – The most top heavy S&P 500 six month performance since May 2000

Market Outlook – The most top heavy S&P 500 six month performance since May 2000

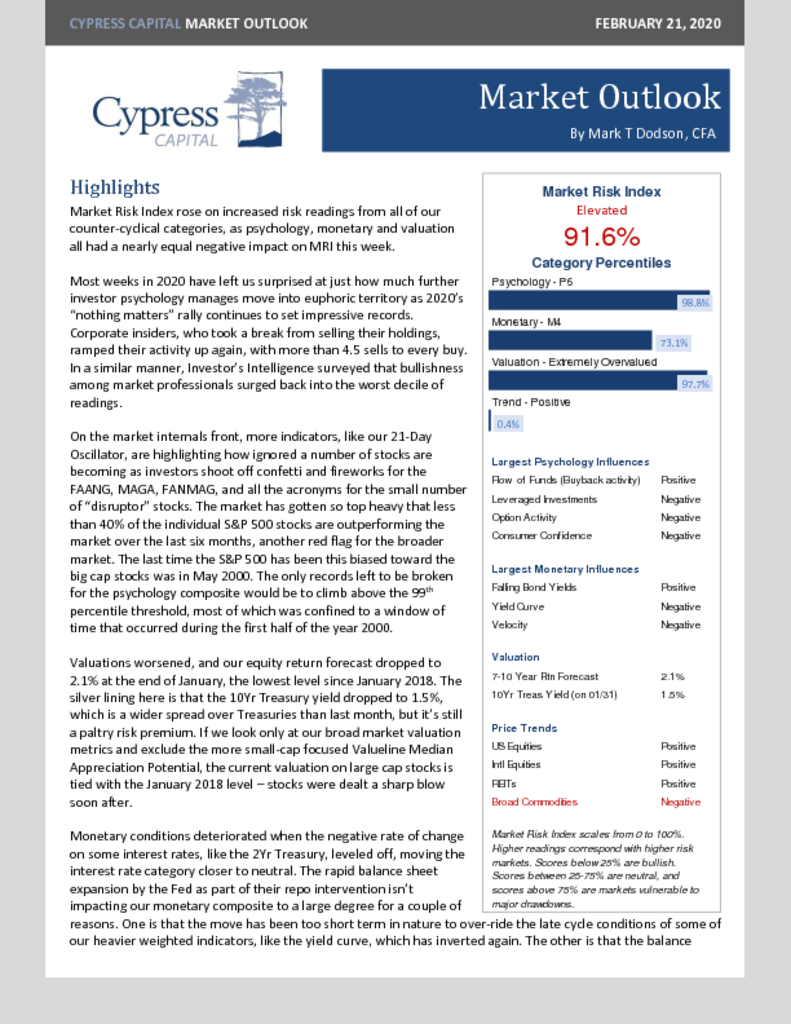
-Market Risk Index increases again on higher risk readings from all three of our counter-cyclical categories – psychology, monetary and valuation.
-Investor psychology is very close to the 99th percentile of euphoric readings – a level mostly confined to a short window of time that occurred during the first half of 2000.
-Valuations have worsened, and big cap valuations are tied with January 2018 levels.
-Less than 40% of S&P 500 stocks have outperformed over the last six months, a red flag for the broader stock market.
-This week in charts had a lot to offer, even after we did our best to cull them down…

World Wrap

World Wrap

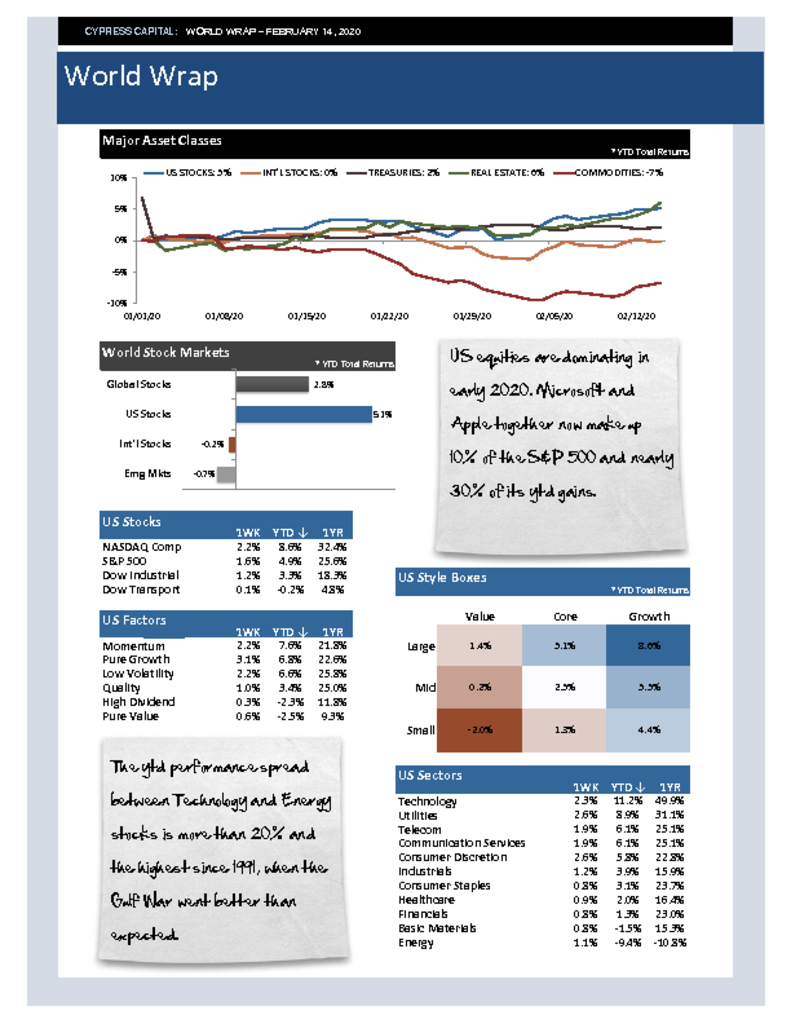
– US equities are dominating in early 2020. Microsoft and Apple together now make up 10% of the S&P 500 and nearly 30% of its ytd gains.
– The ytd performance spread between Technology and Energy stocks is more than 20% and the highest since 1991, when the Gulf War went better than expected.
– Intl equities are down ytd, but China is up more than 1.5% in spite of being the epicenter of coronavirus.
– 20Yr Treasuries, up 6.6% ytd, are beating US equity markets. Bitcoin has surged more than 40% in 2020.

%

Market Risk Index

Market Risk Index scales from 0 to 100%. Higher readings correspond with higher risk markets. Scores below 25% are bullish. Scores between 25-75% are neutral, and scores above 75% are markets vulnerable to major drawdowns.

Model Category Readings (Percentiles)

  • Psychology 99.7% 99.7%
  • Monetary 87.2% 87.2%
  • Valuation 99.3% 99.3%
  • Market Trend 9.8% 9.8%