Archive

Market Outlook – Boomers vs Robinhoodies

Market Outlook – Boomers vs Robinhoodies

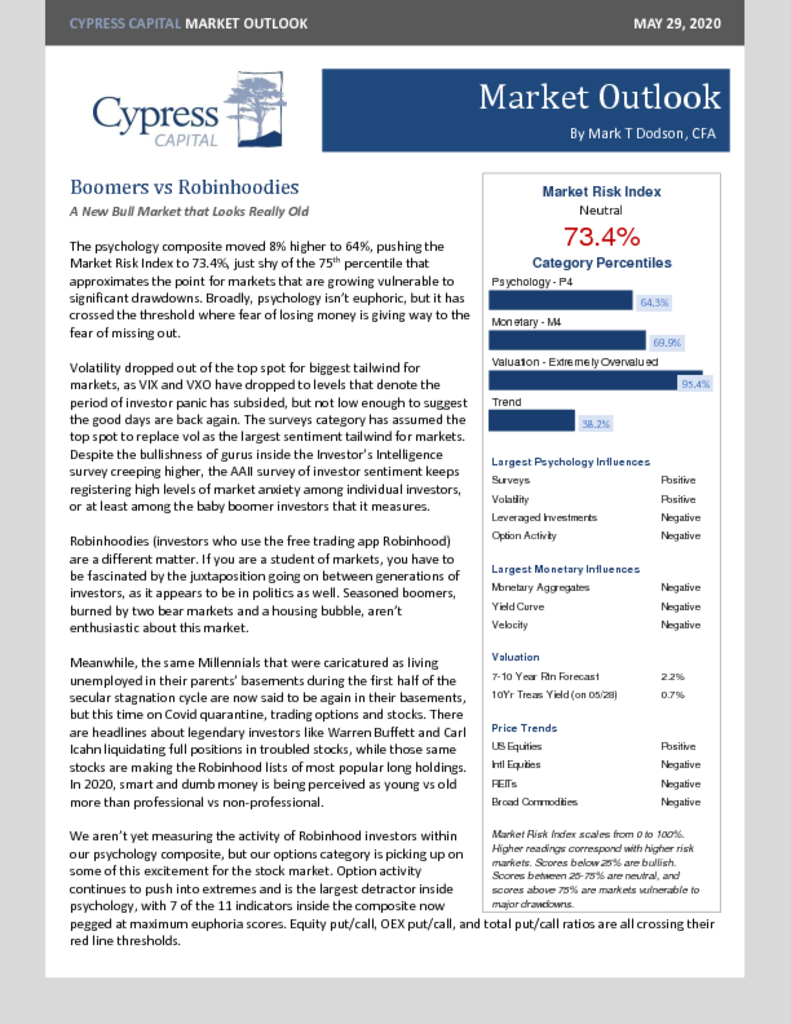
– Market Risk Index moves higher to 73.4%, on another big move within investor psychology.
– Option Activity is hitting extremes, which only happens at the ends of bear rallies, at the ends of bulls, or at the beginning of new bulls.
– In 2020, smart versus dumb money, has become young versus old money.
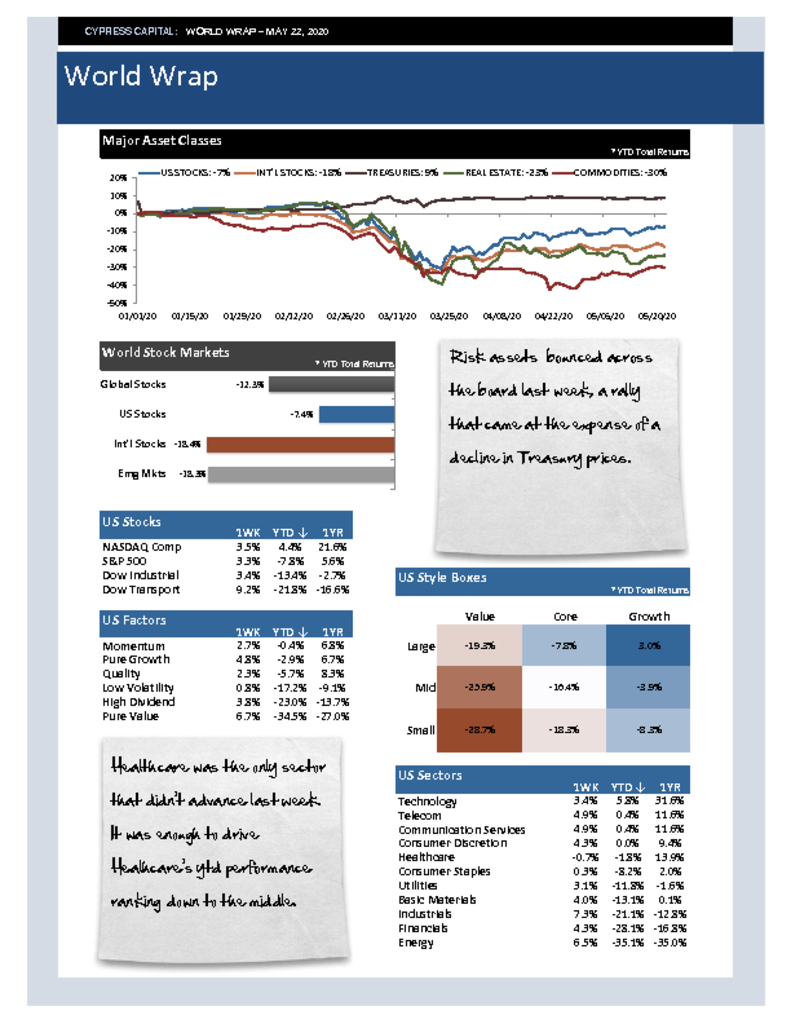
– …and this week’s best charts.

World Wrap

World Wrap

– Risk assets bounced across the board last week, a rally that came at the expense of a decline in Treasury prices.
– Healthcare was the only sector that didn’t advance last week. It was enough to drive the sector’s ytd performance ranking down to the middle.
– Global equities, outside of a pocket of weakness within Asia, rallied as enthusiasm over reopening continues to build.
– Big bounce by economically sensitive commodity prices last week within their bearish trends. Lumber bounced more than 10%.

Market Outlook – The Benjamin Button Bull Market

Market Outlook – The Benjamin Button Bull Market

– Big jump in Market Risk Index, mostly due to investor psychology and lots of call option activity
– For a Bull Market that is only a month old, it looks like some of the oldest in US history. It’s the Benjamin Button Bull Market.
– Professionals throwing in the towel on value in favor of growth, right as it looks like it’s on the cusp of outperforming.
– And, this week’s best charts…

World Wrap

World Wrap

– Bonds rallied, stocks declined, and commodities were flat. US REITs declined more than 8%.
– Technology is the only sector in the black year to date, and Healthcare was the only sector that was in the black last week.
– The US and China continue to escalate rhetoric and tensions. Equity markets for both countries are widely outperforming most countries ytd.
– Large prices swings and divergence among commodity prices last week. Nat gas down 12% – oil up 8% – silver up 8% – Bitcoin down 4.

%

Market Risk Index

Market Risk Index scales from 0 to 100%. Higher readings correspond with higher risk markets. Scores below 25% are bullish. Scores between 25-75% are neutral, and scores above 75% are markets vulnerable to major drawdowns.

Model Category Readings (Percentiles)

  • Psychology 99.7% 99.7%
  • Monetary 87.2% 87.2%
  • Valuation 99.3% 99.3%
  • Market Trend 9.8% 9.8%