Archive

World Wrap

World Wrap

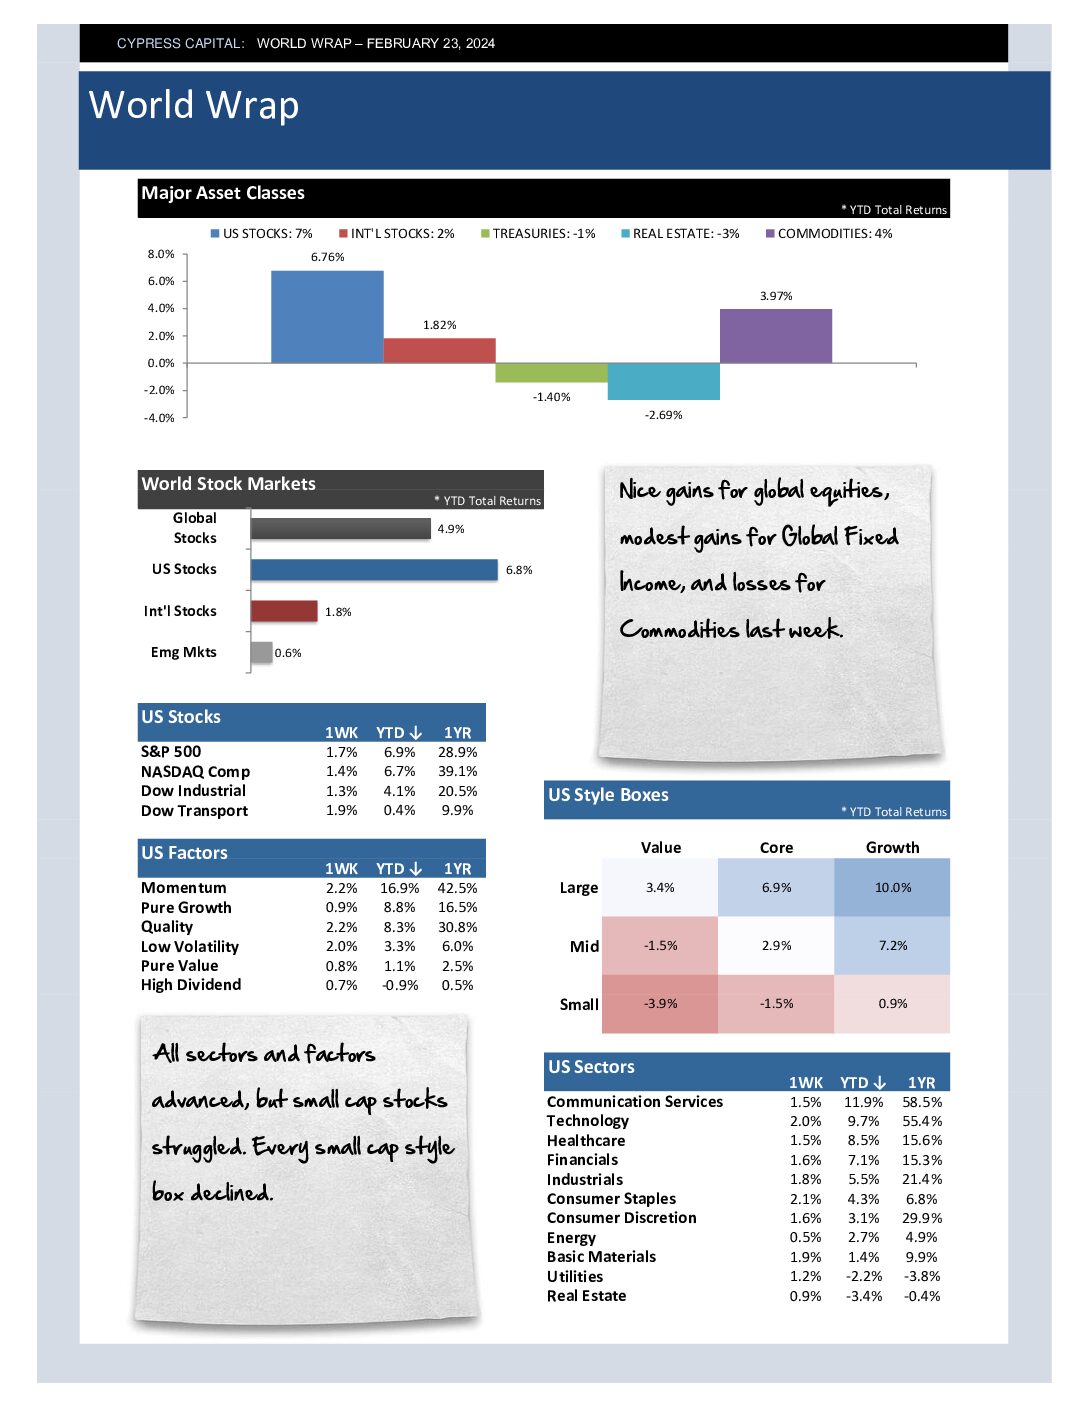
– Nice gains for global equities, modest gains for Global Fixed Income, and losses for Commodities last week.
– All sectors and factors advanced, but small cap stocks struggled. Every small cap style box declined.
– 34 of 45 countries that we follow advanced. China’s equity market has had strong performance two weeks in a row.
– REITs are struggling across the board. They lagged this week despite a rally in bonds. They are the worst performing key asset class year-to-date.

World Wrap

World Wrap

– Mixed performance from key asset classes. International stocks bounced, while US stocks were the worst performing asset class.
– US equities down week was concentrated in Tech and Large Caps. Seven of nine style boxes were up, as were seven of the 11 sectors.
– Broad advance in international markets with 80% of countries advancing. China rallied 3.7%.
– Stronger than expected inflation sent prices on US Treasuries lower. The yield on the 2Yr Treasury has climbed 50 basis points in the last month to 4.6%.

World Wrap

World Wrap

– US Equities and Commodities rallied. They are also the only two major asset classes with positive year-to-date returns.
– All style boxes advanced, but smaller cap stocks and value stocks underperformed. Growth and Tech outperformed.
– International equities were flat, with slightly more than half of countries advancing. More than 60% of countries are down year-to-date.
– US Treasuries declined, and breakevens on US TIPS are starting to signal a rebound in the rate of inflation.

World Wrap

World Wrap

– Prices on US Equities and Treasuries advanced. Foreign equities were flat, and commodities declined.
– The further up the Capitalization and Growth scales, the better the stock did. The smaller and cheaper, the worse stocks fared.
– China declined nearly 4%. China’s stock market is roughly half the value it was nearly 17 years ago, when the globalization era peaked.
– Sharp weekly drop in crude oil prices hurt Commodity indices. US Treasuries and the Dollar rallied.

%

Market Risk Index

Market Risk Index scales from 0 to 100%. Higher readings correspond with higher risk markets. Scores below 25% are bullish. Scores between 25-75% are neutral, and scores above 75% are markets vulnerable to major drawdowns.

Model Category Readings (Percentiles)

  • Psychology 99.7% 99.7%
  • Monetary 87.2% 87.2%
  • Valuation 99.3% 99.3%
  • Market Trend 9.8% 9.8%