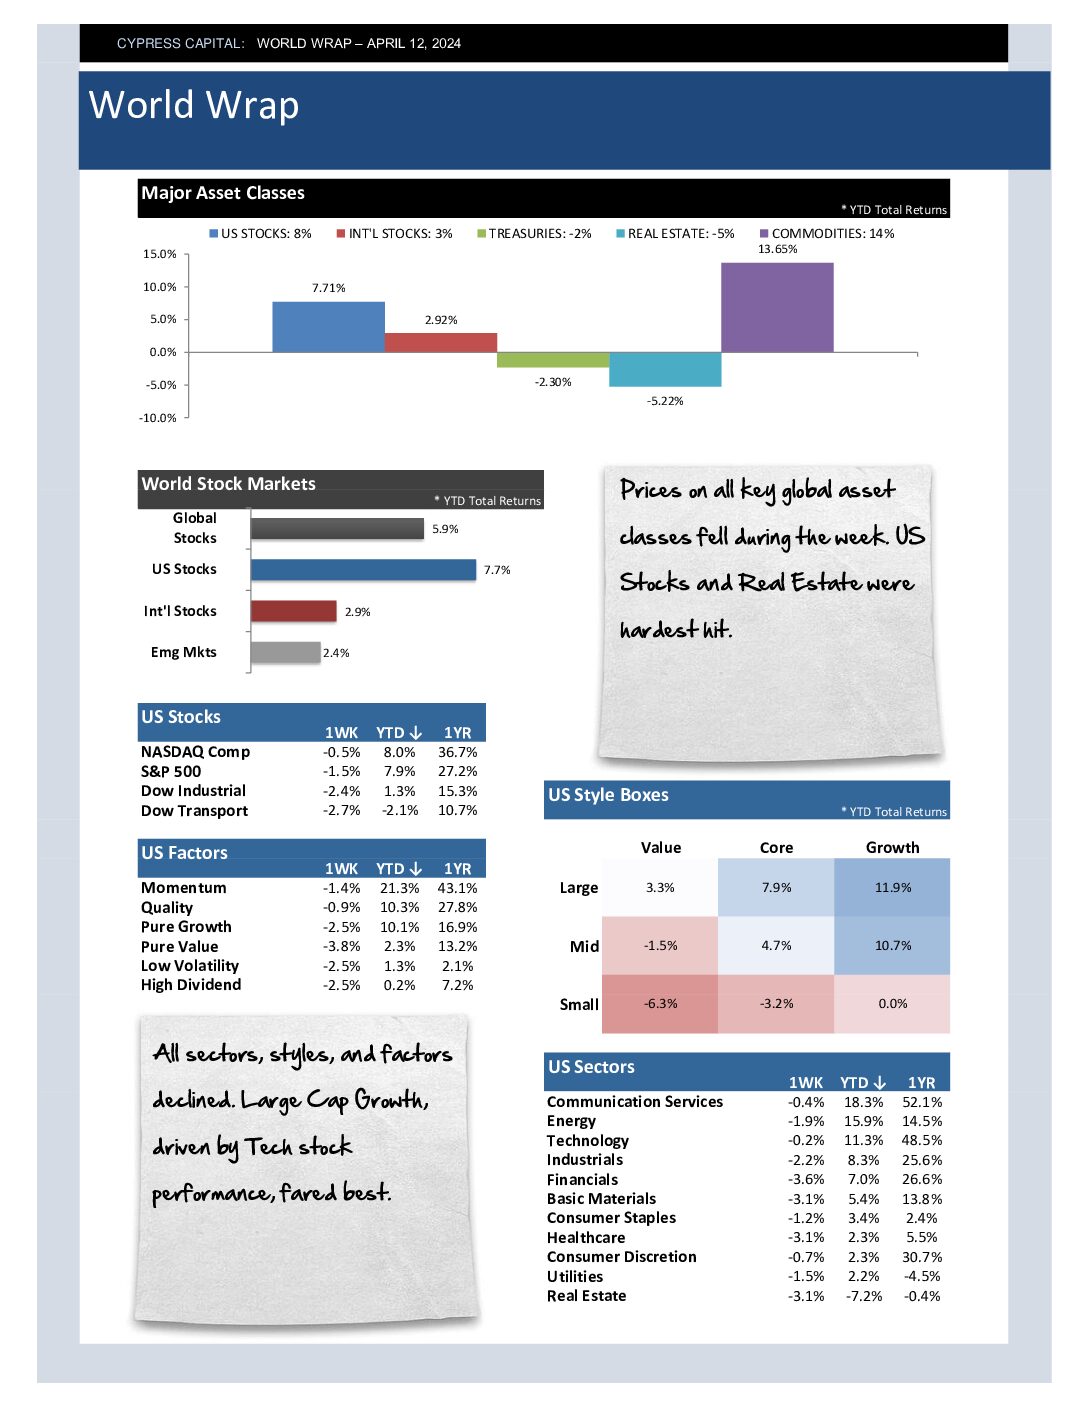
Archive

World Wrap

World Wrap

– Global equities declined for the week, while Treasuries and commodities remained flat.
– Most sectors, styles, and factors were in the red, except for Energy and Utilities, which finished the week higher.
– Internationally, there were pockets of strength, particularly in Latin American and Emerging European stocks.
– Gold prices climbed 3%, setting another new all-time high.

World Wrap

World Wrap

– Intl equities have opened up a sizable lead over key global asset classes after another strong week. U.S. equities are in the red YTD after falling more than 3%.
– While U.S. stocks are down YTD, 9 of 11 sectors remain positive for the year. The decliners – Cons Discretion & Tech – have weighed on highly concentrated indices.
– A powerful, broad rally swept across international markets. German stocks climbed more than 6%, reaching a new all-time high.
– Trade and tariff policy uncertainty weighed on the U.S. dollar and Treasuries, sending the dollar down 3.5% – its largest one-week drop since 2022.

World Wrap

World Wrap

– U.S. Treasuries and real estate outperformed, while global equities and commodities declined.
– U.S. equities fell, but more sectors gained than lost. Safe havens and inflation-sensitive sectors outperformed.
– Emerging markets struggled, with both China and India dropping over 4%.
– A strong week for U.S. fixed income, but not for international fixed income. The dollar rose more than 1%.

World Wrap

World Wrap

– It was a flat to up week for all key asset classes, except US Equities, which fell after Walmart issued a sales growth warning.
– All style boxes declined, but 5 of 11 sectors climbed in a down week. The traditional safe-havens Healthcare, Staples and Utilities were leaders.
– Emerging markets advanced more than 2% last week on a 3.9% jump in China equities. China has started 2025 as one of the world’s best performers.
– US Treasuries rallied as US stocks sold off, bringing the US Treasury Yield Curve within ten basis points of re-inverting.

%

Market Risk Index

Market Risk Index scales from 0 to 100%. Higher readings correspond with higher risk markets. Scores below 25% are bullish. Scores between 25-75% are neutral, and scores above 75% are markets vulnerable to major drawdowns.

Model Category Readings (Percentiles)

  • Psychology 99.7% 99.7%
  • Monetary 87.2% 87.2%
  • Valuation 99.3% 99.3%
  • Market Trend 9.8% 9.8%